Same OEE, opposite fixes: turning the percentage back into minutes
Two machines can report the same OEE and need completely different work. Here's how I turn the score back into minutes a team can act on.

I've spent a good part of my career staring at OEE. On the Unilever lines I worked on, it moved from roughly 60% to roughly 75%, and I'm proud of that. But if I'm honest, the percentage never told us what to do on Monday morning. The minutes did.
This note is about that translation: from one tidy number back to the lost time underneath it, and from there to the right improvement project.
A quick refresher on OEE
Overall equipment effectiveness multiplies three factors (Vorne; the same structure appears in the ISO 22400 KPI standard, summarised by NIST):
| Factor | Question it answers | Formula |
|---|---|---|
| Availability | Was the machine running when it was supposed to? | Run time ÷ planned production time |
| Performance | When it ran, did it run at its ideal speed? | (Ideal cycle time × total count) ÷ run time |
| Quality | Were the parts right first time? | Good count ÷ total count |
| OEE | How much of the planned time made good parts at full speed? | Availability × Performance × Quality |
It's a brilliant compression. The problem is exactly that: it compresses.
One shift, worked through
Here's an illustrative packaging shift, the same example we use in the free OEE calculator on the Vrolen site:
| Input | Value |
|---|---|
| Planned production time | 450 min |
| Stopped | 60 min |
| Ideal cycle time | 0.5 min per unit |
| Units produced | 720 |
| Good units, first pass | 690 |
That gives 86.7% availability, 92.3% performance and 95.8% quality, so 76.7% OEE. Sounds precise. Now put it back into time:
Sixty minutes of stops, thirty minutes of slow running and small stops, fifteen minutes of rejects. That loss profile starts a far better conversation than "we need to raise OEE by five points".
Same score, different problem
It gets more interesting when you compare machines. Two lines, both at 75.2%:
| Machine | Availability | Performance | Quality | OEE |
|---|---|---|---|---|
| A | 80% | 95% | 99% | 75.2% |
| B | 95% | 80% | 99% | 75.2% |
Identical scores. Opposite stories.
- Machine A spends too much planned time stopped. The work is on breakdowns, changeovers and waiting for material.
- Machine B runs almost all shift but loses rate: slow cycles, microstops, starving or blocking from its neighbours, maybe a cycle time nobody has validated in years.
If both teams get the same instruction to "improve OEE", neither of them has actually been told anything. Researchers have made the same point for years: OEE is useful for spotting losses, but equipment-level OEE on its own isn't enough when machines work together as a line (Muchiri & Pintelon, 2008; Braglia, Frosolini & Zammori, 2009).
What moved the number for us
At Unilever the work that moved OEE was mostly unglamorous, and it lined up with the loss types above:
| Loss | What we worked on | What it did |
|---|---|---|
| Stops (availability) | Changeover reduction (SMED), autonomous maintenance | Changeovers roughly halved, from about 90 to about 45 minutes |
| Speed (performance) | Standard work, line-side material flow | Fewer small stops and waits for material |
| Quality | In-process checks, first-pass yield work | Defects caught on the line, not at the end of it |
| Visibility | A downtime and loss dashboard | 60% less time spent preparing production reports |
None of that was one big project. It was ten-plus smaller ones, each aimed at a specific loss, inside a World Class Manufacturing program. The dashboard mattered more than it sounds, because it gave every shift the same picture of where the minutes went.
Four questions before you pick the next project
Even the biggest loss isn't automatically the best thing to fix. Before committing a team, I ask:
- Which factor actually moved? Availability, performance or quality.
- Which events created the loss? Not the category, the actual stops, jams and rejects.
- Is this machine the constraint right now? Recovering minutes on a machine that isn't holding the line back mostly makes a bigger queue.
- Would removing the loss improve good output, lead time or delivery? If not, it can wait.
That third question is where OEE and flow meet, and it's the subject of my note on why busy machines make customers wait.
Where software can help
This is the logic I'm building into Vrolen (more about it here): connect the score to the events underneath it, check whether the loss sits at the constraint, and test a countermeasure on a model of the line before anyone changes the real one.
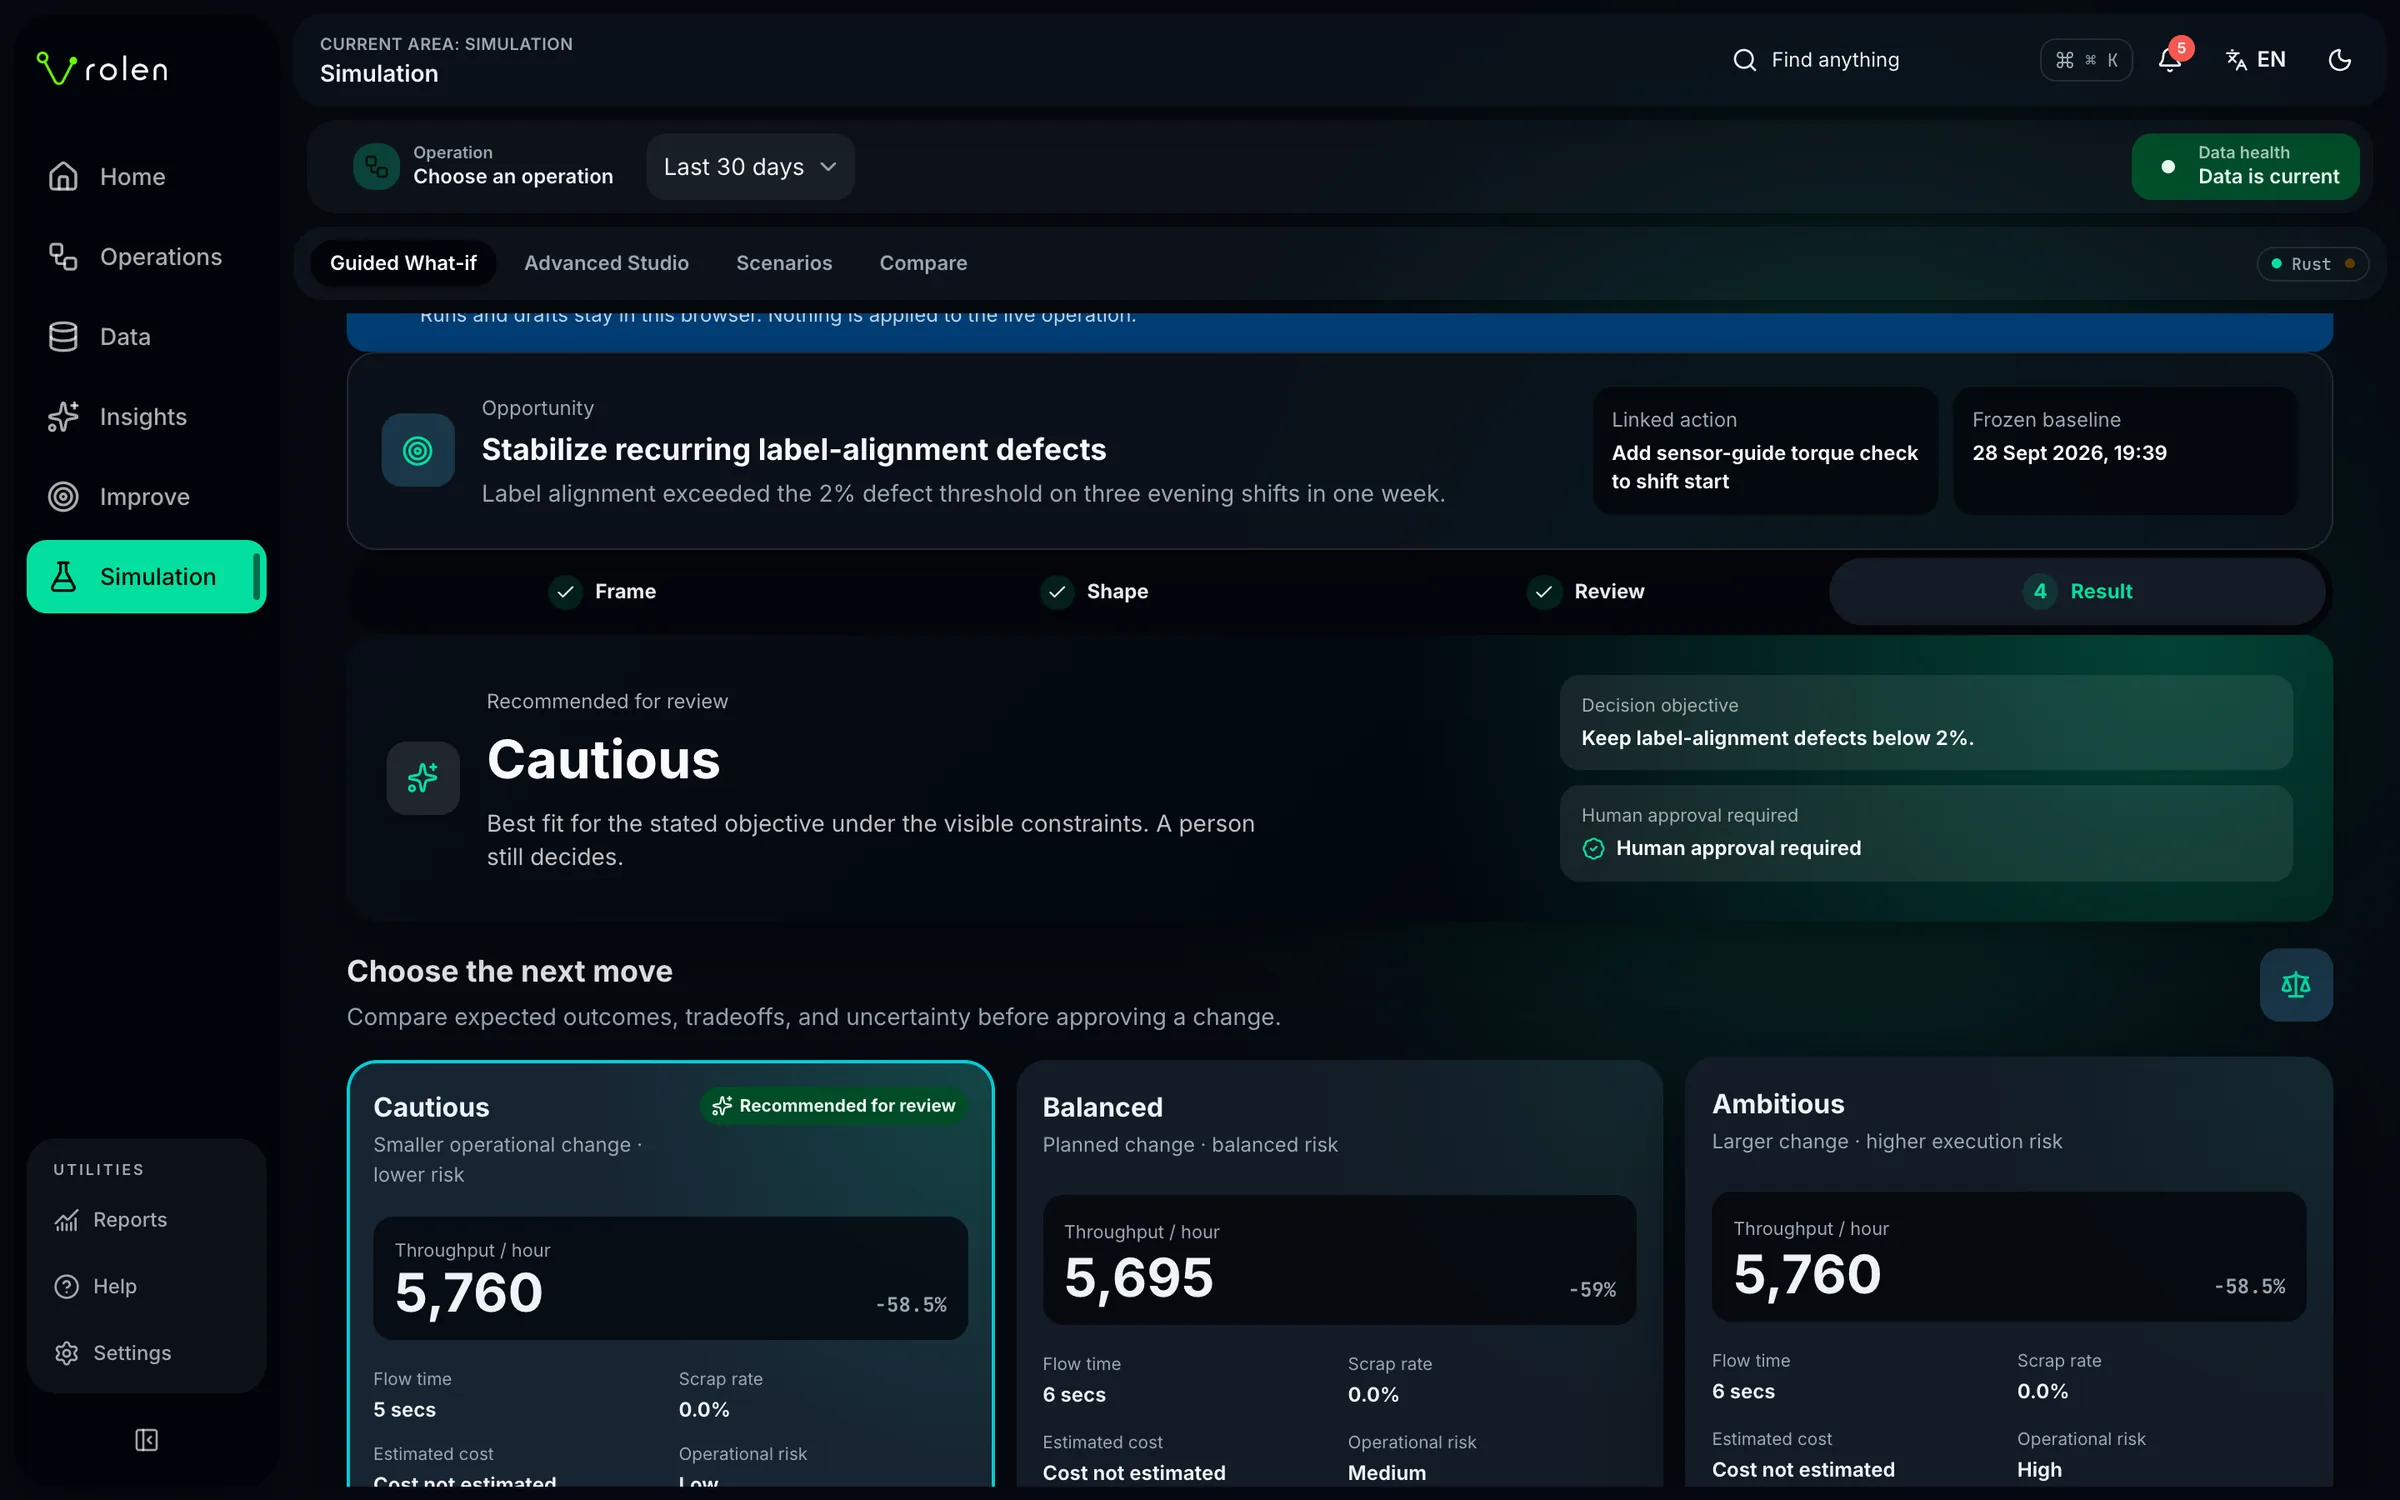
The tool is the easy part, though. The habit that matters is asking "which minutes?" every time someone quotes a percentage. If you want to try the translation on your own line, the free OEE calculator shows the minutes behind each factor.
Sources
- Vorne, OEE calculation: definitions, formulas and examples
- NIST, ISO 22400 KPI definitions applied to manufacturing visualisation
- Muchiri, P. & Pintelon, L. (2008). Performance measurement using overall equipment effectiveness (OEE). International Journal of Production Research.
- Braglia, M., Frosolini, M. & Zammori, F. (2009). Overall equipment effectiveness of a manufacturing line (OEEML). Journal of Manufacturing Technology Management.
- Jain, S., Shao, G. & Shin, S.-J. (2016). Methods and tools for performance assurance of smart manufacturing systems. Journal of Research of NIST.
The shift and machine figures are illustrative. The Unilever figures are approximate and from my own work.